Safari has a hidden “Debug” menu that offers some additional features for debugging the browser, including stress and load tests, sampling, javascript error logging, the ability to intentionally crash a page, and more. Intended for Safari developers, the Debug menu is different from the Developer menu, which is geared more at web developers, although there are a few options in the Debug menu that general web developers would find useful as well, notably advanced cache choices and CSS animation controls. If this sounds confusing, just enable both of them and poke around and you’ll quickly see the differences.
Here’s how to enable the hidden Debug menu in Safari for Mac OS X with the assistance of a defaults command string in the terminal.
How to Enable Safari’s Hidden Debug Menu on Mac
This works in all versions of Safari in nearly all versions of OS X, from all modern releases to most prior versions as well:
- Quit Safari in OS X
- Launch the Terminal from /Applications/Utilities/ and enter the following defaults write command exactly:
defaults write com.apple.Safari IncludeInternalDebugMenu 1
- Hit return, then relaunch Safari
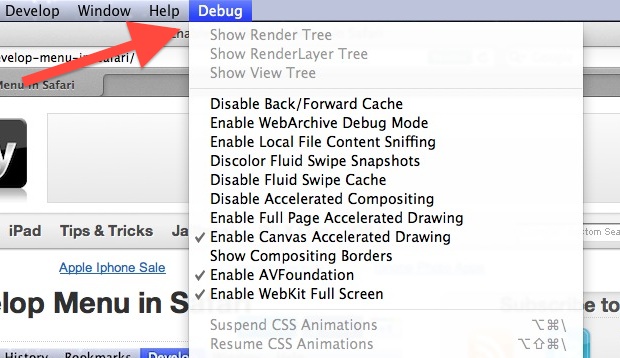
The “Debug” menu will be visible to the far right in Safari’s menubar choices.
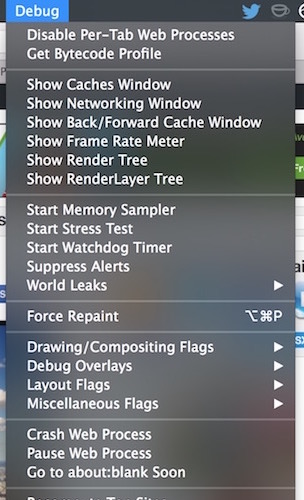
If you want to disable the menu, go back to the Terminal and type:
defaults write com.apple.Safari IncludeInternalDebugMenu 0
Again you will need to relaunch Safari for changes to take effect.
We’ve poked around in the Debug menu before to stop auto-refreshing in Safari by disabling multi-process windows, that is no longer necessary with the latest version of Safari, however.
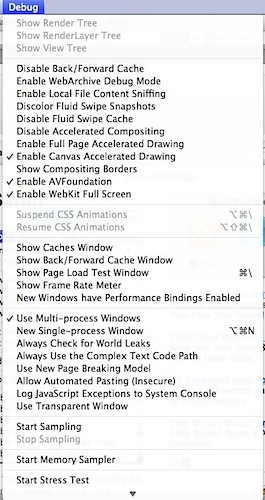
Generally aimed at developers, Safari debugging, and web workers, the Debug menu has many features that can be useful to more advanced Safari users as well.


 [android] 초간단 HTTP, POST 전송 샘플
 Enable the Develop Menu in Safari


